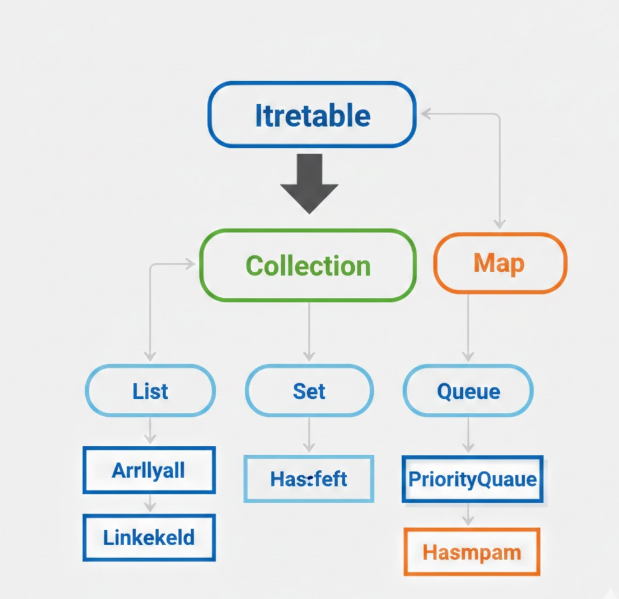
Starting your journey into Computer Science is a bit like learning to solve puzzles that change shape while you are holding them. Java is often the first language students use to build these puzzles, especially when moving beyond basic variables and into the world of “Complex Data Structures.” Whether it is a nested HashMap, a custom LinkedList, or a Binary Search Tree, these structures are the backbone of efficient software. However, they also come with a unique set of headaches. When your code crashes with a NullPointerException or a memory leak, it can feel like you are searching for a needle in a digital haystack.
Debugging is not just about fixing a mistake; it is a critical skill that defines a great developer. If you find yourself stuck and thinking, “I need someone to do my assignment uk,” you are not alone; many students at myassignmenthelp start with that same frustration before mastering these tools. Understanding how to peel back the layers of a complex object in your IDE (Integrated Development Environment) is the first step toward coding independence. By learning to watch how data flows through your memory, you stop guessing and start knowing exactly why your program is behaving the way it is.
The Anatomy of a Java Bug
In the world of Java, bugs are rarely random. They are usually the result of a misunderstanding of how the Java Virtual Machine (JVM) manages memory. When you work with simple integers or booleans, data is stored directly. But with complex structures, you are dealing with “References.” Think of a reference like a GPS coordinate. If the coordinate points to an empty field, and you try to build a house there, the program crashes.
Most students spend hours staring at their code, hoping the error will jump out at them. This “eyeballing” method works for a 10-line program, but for a 500-line project involving Dijkstra’s algorithm or a B-Tree, it is impossible. You need a systematic approach: reproducing the bug, isolating the cause, and then applying a verified fix.
1. The “Problem” Cluster: Identifying Common Java Glitches
Before you can fix a bug, you have to name it. In Java, data structure bugs usually fall into a few predictable categories. The most famous is the NullPointerException (NPE). This happens when you try to access a method or a field of an object that hasn’t been initialized yet. Imagine trying to open a door that doesn’t exist; Java simply gives up and throws an error.
Another sneaky issue is the ConcurrentModificationException. This typically occurs when you are looping through a collection, like an ArrayList, and you try to remove an item at the same time. Java’s “fail-fast” iterators notice the structure has changed and stop the program to prevent data corruption. Students often struggle with these logic errors because the code “looks” right, but the timing is wrong.
Then there is the ArrayIndexOutOfBoundsException. This is a classic “Off-by-One” error. In Java, arrays are zero-indexed. If you have an array of 10 items and you try to access index 10, you crash. While this seems simple, it becomes incredibly complex when you are implementing a Heap or a PriorityQueue where index math (like 2*i + 1) determines the parent-child relationship.
2. The Power of the Stack Trace
When your program crashes, Java provides a “Stack Trace” in the console. Most students see this wall of red text and close the window in panic. However, the stack trace is your best friend. It is a chronological map of every function call that happened before the crash.
To read a stack trace, look at the very top line. It tells you the type of error. The lines below it tell you the exact file name and line number where the error occurred. By clicking these links in your IDE, you can jump directly to the crime scene. If the error is deep inside a Java library (like java.util.ArrayList), look further down the list until you find a file name you recognize—that is where your logic went wrong.
3. The “Solution” Cluster: Tools of the Trade
To solve these mysteries, you need more than just System.out.println statements. While printing variables to the console is a classic move, it is incredibly slow for complex structures. Modern tools like IntelliJ IDEA, Eclipse, and VS Code provide a “Debugger” mode that lets you pause time.
By setting a “Breakpoint” (the red dot next to the line number), you can stop your program on a specific line and inspect the “Heap.” This allows you to see every node in your LinkedList and where their “next” pointers are actually pointing.
If you are also working on other languages and searching for python assignment help online, you will find that these debugging concepts—like “stepping over” (running the line) and “stepping into” (entering a function)—are universal skills that apply to almost every modern programming language. In 2026, the ability to use a debugger is more valuable than knowing the syntax of the language itself.
4. Deep Dive: Debugging HashMaps and Trees
When data structures get “nested” (like a HashMap that contains a List of objects), the complexity doubles. A common bug here is “Hash Collisions” or incorrect equals() and hashCode() implementations. If you don’t override these methods correctly, Java won’t be able to find your data, even if you just put it there.
When debugging a tree, the most common trap is the “Infinite Loop” caused by a missing base case in your recursion. To fix this, use the “Call Stack” view in your debugger. It shows you how many times a function has called itself. If you see the same function name repeated 500 times, you’ve found your infinite loop!
5. Memory Management: The Silent Killer
Java has a “Garbage Collector” (GC) that automatically cleans up objects you aren’t using anymore. However, students often create “Memory Leaks” by keeping references to objects they don’t need. If you add 1,000,000 objects to a Static List and never clear it, your program will eventually run out of memory (OutOfMemoryError).
To debug this, you need a “Heap Profiler” like VisualVM. It shows you a pie chart of what is taking up your RAM. If you see that 90% of your memory is “String” objects from a log file you forgot to close, you know exactly what to delete. This level of analysis is what separates a student from a professional software engineer.
6. Logic vs. Syntax: The Mental Shift
Many 12th-grade and first-year university students treat coding like a spelling bee. They think if there are no red squiggly lines, the code is perfect. But “Logic Errors” are the real villains. A logic error is when the code runs perfectly but gives the wrong answer—like a calculator that says 2+2=5.
To catch these, use Unit Testing. Writing a small script using JUnit to test your data structure with 1 item, 0 items, and 1,000 items is the best way to find bugs before they happen. If your Stack.pop() works for a full stack but crashes for an empty one, your unit test will catch it instantly.
7. Strategic Debugging: The “Divide and Conquer” Method
If you have a massive block of code and don’t know where the bug is, use the “Comment Out” method. Comment out half of your logic and see if the error persists. If it does, the bug is in the remaining half. Repeat this until you have narrowed it down to a single line. This is mathematically the fastest way to find a bug in a large system.
8. The Role of Documentation and Comments
While it isn’t a “tool” in the traditional sense, writing clean code is a debugging strategy. Using descriptive variable names like customerList instead of cl makes it much easier to spot errors during a “Code Review.” If you find yourself struggling to explain what a line of code does, it is probably too complex and needs to be simplified.
See also: How DeFi Protocols Earn Revenue
9. Collaborative Debugging and Peer Review
Sometimes, you are too close to the problem. Your brain sees what it expects to see, not what is actually on the screen. This is where “Rubber Duck Debugging” comes in. Explain your code, line by line, to an inanimate object (or a friend). Often, as you describe the logic out loud, you will realize the mistake yourself.
In 2026, the global coding community is more connected than ever. Forums like StackOverflow and GitHub Discussions are great, but for academic-specific hurdles, professional programming assignment help services provide a structured way to learn from experts who have seen these bugs thousands of times.
10. Final Tips for First-Page Success
To truly master Java, you must treat debugging as a science. Form a hypothesis, test it with a breakpoint, and observe the results. If you are consistent, you won’t just pass your classes; you’ll build software that is robust, scalable, and professional.
Remember, every single expert developer you admire has spent days crying over a semicolon or a null pointer. The difference between them and a beginner is that they didn’t give up—they just got better at using their tools. Whether you are dealing with a simple array or a complex graph database, the principles remain the same: isolate, inspect, and improve.
If you ever feel overwhelmed by these technical hurdles, remember that every expert was once a beginner. Whether you are seeking a bit of extra guidance or specialized academic support, the goal is always the same: to understand the logic so you can build something amazing.
Frequently Asked Questions
What is the difference between a syntax error and a logical error in Java?
A syntax error is a “grammar” mistake, like a missing semicolon, that prevents your code from compiling. A logical error occurs when your code runs perfectly but produces the wrong result—for example, accidentally using a plus sign instead of a minus sign in a math formula.
Why is my program throwing a NullPointerException with data structures?
This common crash happens when you try to use an object that hasn’t been created in memory yet. In complex structures like linked lists or trees, it often means a “pointer” is looking at an empty space (null) instead of the next node or data element.
How do breakpoints help in debugging complex collections?
Breakpoints allow you to pause your program at a specific line to see exactly what is happening inside your variables. This is essential for structures like HashMaps, as it lets you inspect “hidden” data like keys and values to see where the logic is breaking during execution.
What is a memory leak and how does it affect Java performance?
A memory leak occurs when your program keeps hold of data it no longer needs, preventing the system from reclaiming that space. Over time, this fills up the “Heap” memory, causing your program to slow down significantly or eventually crash with an OutOfMemory error.
About the Author
Ella Thompson is a dedicated technical writer and computer science enthusiast with a passion for simplifying complex programming concepts for students worldwide. With a background in software development and academic mentoring, Ella specializes in Java architecture and data-driven research. Currently, Ella collaborates with MyAssignmentHelp to produce high-quality educational resources that empower the next generation of developers to master their craft.